Overview of key figures
Revenues decreased mainly as a result of the development of freight rates at DB Schenker.
Read more
The punctuality in rail transport in Germany has reduced due to rail passenger transport.
Read more
Adjusted EBIT declined noticeably as a result of freight rate normalization at DB Schenker.
Read more
Gross capital expenditures increased significantly from an already high level, mainly due to a significant increase in infrastructure capital expenditures.
Read more
In total, the number of employees remained at a stable level. Increases in the Integrated Rail System were almost completely offset by portfolio changes at DB Arriva.
Read more












Social responsibility
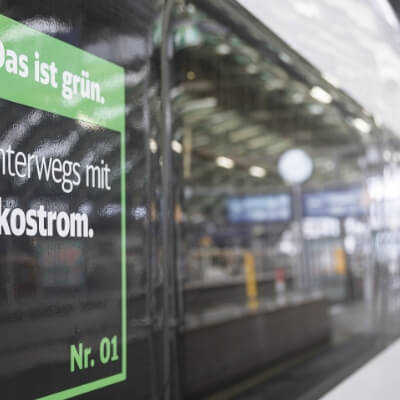
With more than 300,000 employees worldwide, billions of passengers and a large number of partners, DB Group occupies a central role in the heart of society ... read more
Work of the future
The Week of New Work has become an important internal showcase of ideas and networking for the topic of New Work and Future of Work, cooperation, customer orientation, leadership, purpose, digitalization and sustainability ... read more
Diversity
Women in leadership initiative: on the way to the milestone of 30% female executives by the end of 2024, DB Group is developing a range of concepts and offers ... read more
Qualification
Knowledge transfer in the metaverse: in May, the Bahn360 project for the digital transfer of railway knowledge won the public prize in the international Webby Awards category “Metaverse, Immersive&Virtual, ... read more